Salaheldinaz

Search posts

Table of contents
AI-generated illustration: A large container ship crossing a dark sea under a dusky sky, a thin pale arc curving overhead.

The Analyst's Stack Part 8 of 22

Finding dark vessels with satellite imagery

12 min read osint geoint satellite maritime automation project
The Analyst's Stack · Showcase

A tool that reads satellite imagery for ship-shaped objects, then asks the AIS record which of them were transmitting — and flags the ones that were not.

Why I built it

Ships broadcast where they are. Most of the time.

AIS (the transponder system vessels use to broadcast identity and position to anyone listening; it can be switched off from the bridge) is how you know what is where at sea. It works right up to the moment someone would rather you did not know, and then it stops silently. A switched-off transponder leaves no gap and no error. Just a ship that is no longer in the feed.

So the thing you want to find is defined by its absence from the only dataset you have. You need a second look that does not depend on the vessel agreeing to be seen, and a satellite is that look.

By hand it is miserable: pull a scene, stare until bright specks resolve into something ship-shaped, note coordinates, switch to an AIS tool, type each position in, line up timestamps, repeat. One scene is an afternoon. A month of scenes is not a task anybody finishes.

What it solves

It turns the afternoon into a list.

You draw an area, pick a scene, and the machine does the staring. It finds the bright spots, drops the ones that are land or the wrong size for a ship, cuts a small image chip of each survivor, and asks the AIS record whether anything was transmitting from that position at that moment. Every row gets a verdict on the AIS record, never on the ship: AIS match, possible AIS match, unmatched with AIS nearby, plain unmatched, or no AIS coverage when there was no AIS data to check against.

The filters are blunt on purpose. Anything working out shorter than 90 metres or longer than 500 metres is dropped, as is anything within 150 metres of the shoreline — a coastline is violently bright to radar and will otherwise fill your list with rocks. Losing small craft is a real cost, paid knowingly.

The ceiling sits above the longest ships afloat, about 400 metres, because radar reads a hull long. A study of 127 Sentinel-1 ships checked against AIS (Stasolla and Greidanus, Remote Sensing Letters, 2016) found lengths about 15% out on average, around 30 metres, mostly on the long side, so a 400-metre hull can read about 460 and a 400-metre cutoff would lose the largest real ships.
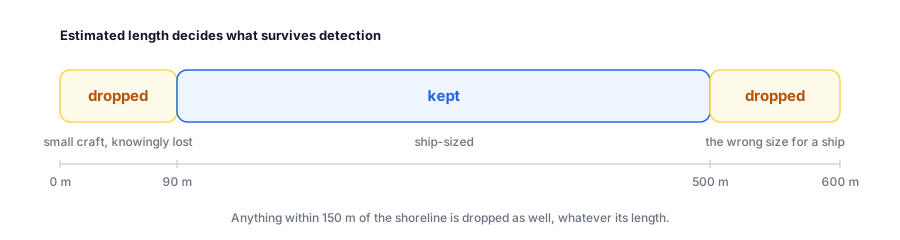
A length scale from 0 to 600 metres. Detections under 90 metres are dropped, small craft knowingly lost; detections over 500 metres are dropped as the wrong size for a ship; only the band from 90 to 500 metres is kept, highlighted. A note says anything within 150 metres of the shoreline is dropped as well, whatever its length. A length scale from 0 to 600 metres. Detections under 90 metres are dropped, small craft knowingly lost; detections over 500 metres are dropped as the wrong size for a ship; only the band from 90 to 500 metres is kept, highlighted. A note says anything within 150 metres of the shoreline is dropped as well, whatever its length.
The filter, to scale. Everything outside the highlighted band never reaches the cross-check, whatever it was.

Its synthetic demo shows the map, labels and detection cards before you hold any provider credentials; running detection needs a fetched scene.
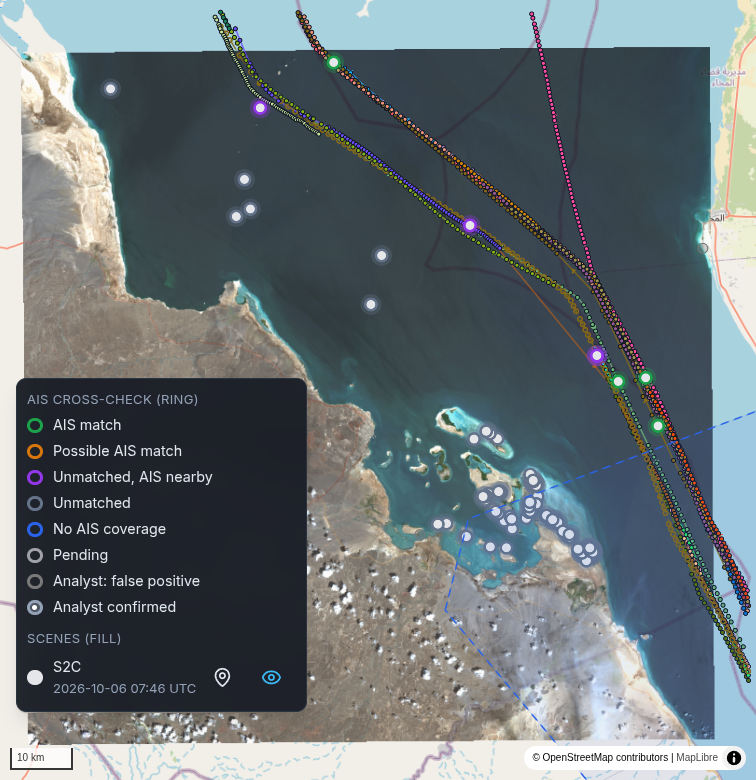
A map of the southern Red Sea off Assab, Eritrea, with a square Sentinel-2 scene of 6 October 2026 laid over the basemap: the Eritrean coast and desert on the left, open water in the middle, the Yemeni shore at the top right. Coloured AIS tracks run down a shipping lane from the top of the scene to its south-east corner. Green AIS match rings sit on those tracks, purple Unmatched, AIS nearby rings lie beside them, and grey Unmatched rings dot the open water and cluster among the islands and shallows south-east of the coast. A magnified legend lists the ring colours: AIS match, Possible AIS match, Unmatched, AIS nearby, Unmatched, No AIS coverage, Pending, Analyst: false positive and Analyst confirmed, then the scene, S2C, 2026-10-06 07:46 UTC.

The view you actually work in. The labels are where the work starts, not where it ends. One of my own projects, on a real Sentinel-2 scene of the southern Red Sea off Assab, Eritrea, 6 October 2026 at 07:46 UTC, checked against 465 AIS positions from 18 transmitters within 2 hours of it: 121 detections. The 4 green rings on the shipping lane are AIS matches, the purple ones are unmatched with AIS nearby, and the grey ones are plain unmatched, most of them among the islands and reefs. The map hides a few points in cloud or of low contrast; the legend is magnified. Contains modified Copernicus Sentinel data 2026; basemap © OpenStreetMap contributors. The legend’s 2 analyst rows are other marks: dark candidate is set from a row’s menu and shows as a Dark candidate (analyst) chip on that row.

How it works

Six stages left to right: Search across optical and radar sources, Fetch one scene and tile it, Detect bright spots against their local background, Cross-check against AIS within 2 hours, Label as a match or unmatched, Map for a human to decide. Cross-check is highlighted. Six stages left to right: Search across optical and radar sources, Fetch one scene and tile it, Detect bright spots against their local background, Cross-check against AIS within 2 hours, Label as a match or unmatched, Map for a human to decide. Cross-check is highlighted.
The spine, wearing a hat. Six boxes, but detect and cross-check are both stage 4 — narrowing, not deciding. Cross-check is highlighted because detection on its own only tells you there is a ship.

Search queries several imagery archives at once against your area and dates. Optical imagery is a photograph: easy to read, useless under cloud or after dark. SAR (radar imaging, where the satellite sends its own pulse and measures what comes back, so it sees through cloud and at night, at the cost of looking nothing like a photograph) has neither problem.

Fetch downloads one scene and cuts the raster into 4096×4096 pixel tiles with a 64-pixel overlap, so a vessel on a tile boundary is not quietly sliced in half.

Detect runs the pipeline that suits the sensor — a water index and connected components for optical, a speckle filter and then CFAR (a detection rule that sets its threshold from the background immediately around each pixel, so a bright spot is judged against its own neighbourhood rather than one fixed brightness for the whole scene) for radar. Sea clutter varies enormously across a single scene, so a fixed threshold goes blind in the rough part and drowns in false alarms in the calm part.

Cross-check looks for AIS positions within 8 kilometres and 2 hours of each surviving detection, projects each nearby track to the moment of the image, and scores the best fit; the score decays with distance and with time. Nothing nearby earns unmatched, but only where AIS data was loaded; with no data at all the row reads no AIS coverage, because an empty feed proves nothing.

Label and map put it in front of a person, with a control that records an analyst’s judgement next to the machine’s.
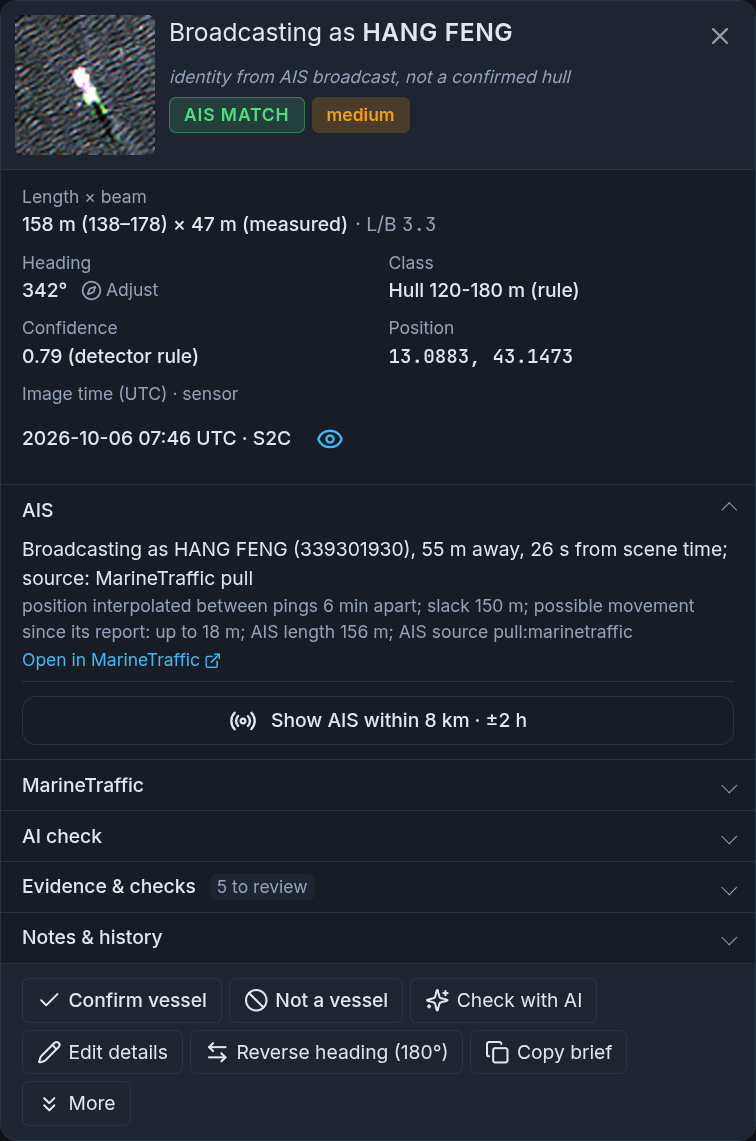
A detection card, magnified. The heading Broadcasting as HANG FENG, the line identity from AIS broadcast, not a confirmed hull, a green AIS MATCH chip and a medium chip, beside a small image chip of a bright hull on rippled water. Below: length × beam 158 m (138–178) × 47 m (measured), L/B 3.3, heading 342°, class Hull 120-180 m (rule), confidence 0.79 (detector rule), position 13.0883, 43.1473, image time 2026-10-06 07:46 UTC, S2C. The AIS section reads Broadcasting as HANG FENG (339301930), 55 m away, 26 s from scene time; source: MarineTraffic pull, then position interpolated between pings 6 min apart, slack 150 m, possible movement since its report up to 18 m, AIS length 156 m, and an Open in MarineTraffic link. Collapsed sections for MarineTraffic, AI check, Evidence & checks (5 to review) and Notes & history, and buttons for Confirm vessel, Not a vessel, Check with AI, Edit details, Reverse heading (180°), Copy brief and More.

One row, expanded. A label that says AIS match beside a chip that says sandbank is a disagreement worth seeing early. Here the two agree: the return measures 158 metres on the image, and the ship broadcasting as HANG FENG, 55 metres away and 26 seconds from the image, gives its own length as 156. The card still says broadcasting as, not is: the name comes from the transponder, not the hull. A real detection on the shipping lane east of Assab, from the same scene. Card magnified for legibility.

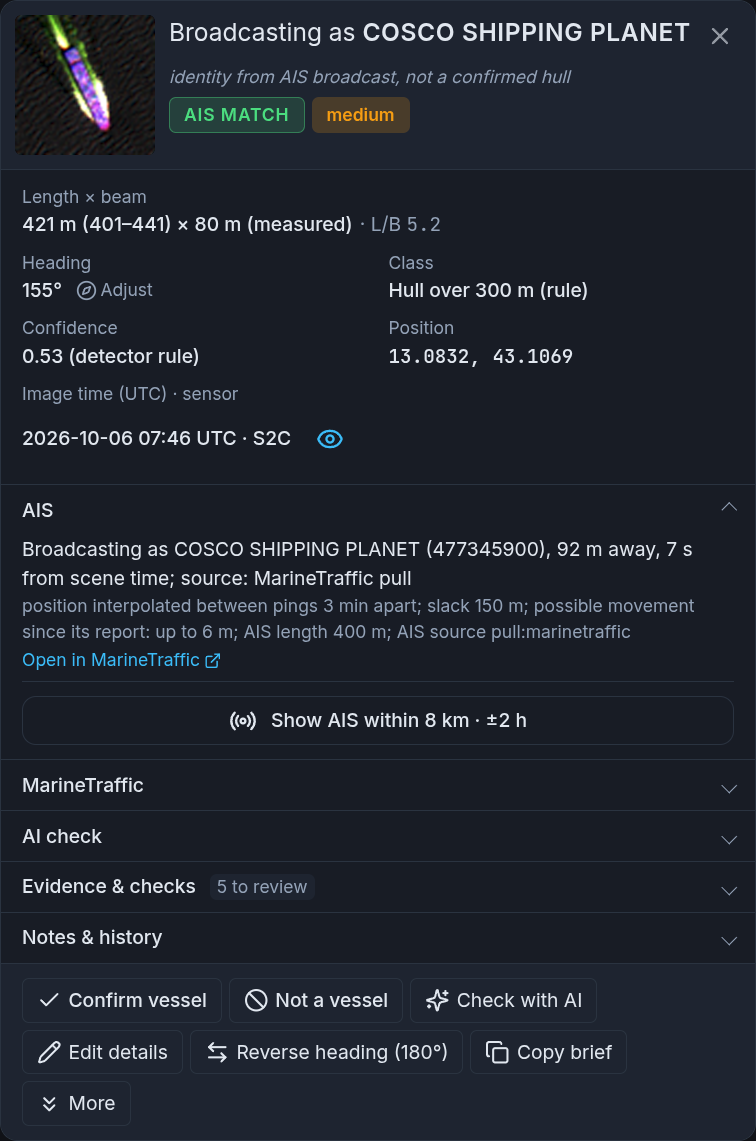
A second detection card, magnified, in the same layout. The heading Broadcasting as COSCO SHIPPING PLANET, identity from AIS broadcast, not a confirmed hull, a green AIS MATCH chip and a medium chip, beside an image chip of a long bright hull. Length × beam 421 m (401–441) × 80 m (measured), L/B 5.2, heading 155°, class Hull over 300 m (rule), confidence 0.53 (detector rule), position 13.0832, 43.1069, image time 2026-10-06 07:46 UTC, S2C. The AIS section reads Broadcasting as COSCO SHIPPING PLANET (477345900), 92 m away, 7 s from scene time; source: MarineTraffic pull, then position interpolated between pings 3 min apart, slack 150 m, possible movement since its report up to 6 m, AIS length 400 m, and an Open in MarineTraffic link, above the same collapsed sections and buttons.

The long end of the band. A return measured at 421 metres, 401 to 441, against the 400 metres the ship broadcasting as COSCO SHIPPING PLANET gives for itself, 92 metres away and 7 seconds from the image. Even on an optical image it reads 21 metres long, and a 400-metre ceiling would have dropped one of the largest ships afloat. Same scene, a few kilometres west of HANG FENG. Card magnified for legibility.

How I built it

The back end is Python 3.12 on FastAPI with Postgres and PostGIS underneath, the front end React with MapLibre, all of it under Docker Compose.

PostGIS was the decision that kept paying. The cross-check is a spatial-and-temporal question — what was near here, around then — and once the database answers that natively, the join is a query instead of a pile of loops.

The hard part was not the detection maths. A real scene is large and the download is slow, so the work has to survive being long-running, and the front end needed a stall detector before it behaved: a job that has stopped looks identical to a job being thorough.

Credentials were the other tax. A public archive turned out to use 2 authentication systems that do not accept each other’s tokens, failing a long way from the cause. That cost a day.

What I would do differently: the detection constants are compiled in. Threshold multiplier, ring sizes, chip dimensions — tuned once against the scenes I had. That was right for getting it working; it is now the main thing between this tool and a sea state it has not met.
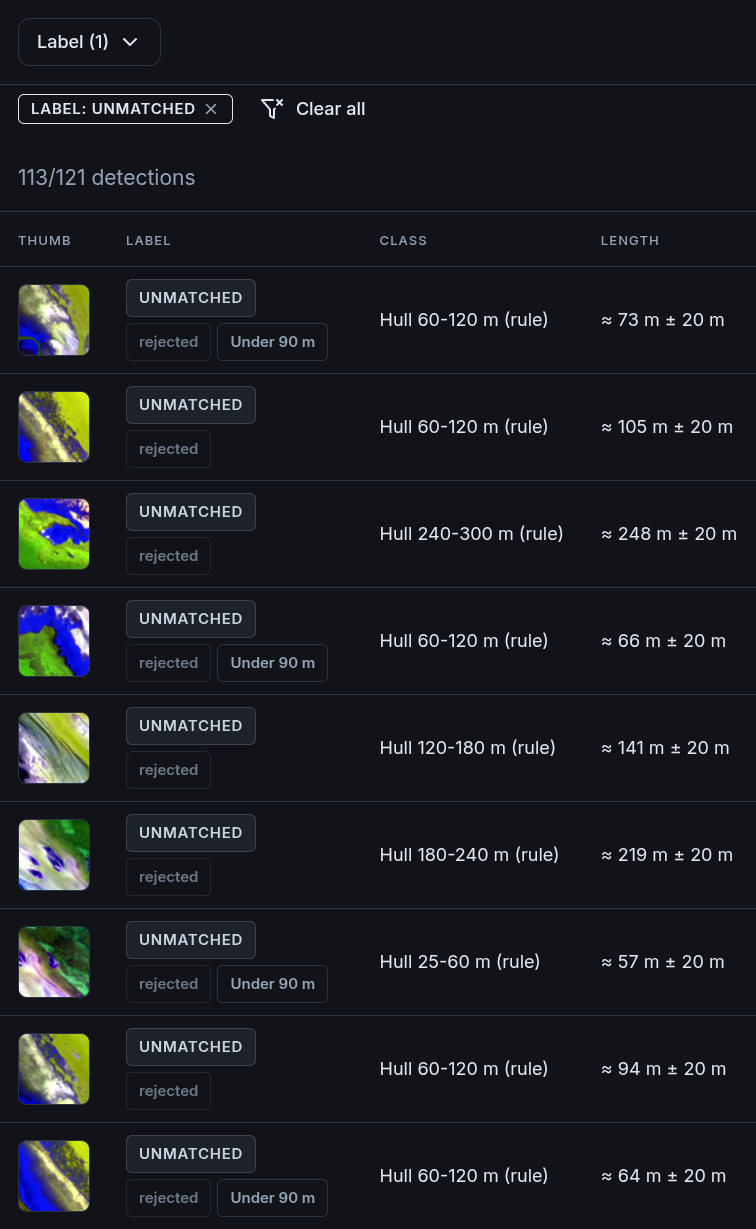
The detections table filtered by a LABEL: UNMATCHED badge, the Label filter showing (1), and the count 113/121 detections. Each row has a small image chip, most of them a bright strip of shoreline or land beside blue water, an UNMATCHED label with a grey rejected chip and, on some rows, an Under 90 m chip, a size class such as Hull 60-120 m (rule), and a length such as about 73 m plus or minus 20 m.

The output that justifies the build. Everything upstream exists to make this list readable. The same Red Sea scene filtered to Unmatched: 113 of 121 detections. These first rows come from the islands and reefs, and their chips show shoreline, not hulls; rejected is the print rating, meaning not to be published. Rows flagged Under 90 m are here because this project’s minimum length was lowered to 49 metres. Even unmatched is a lead, never an accusation against any ship. The optional AI step sends each chip with the scene date, sensor and measured length, never the coordinates, to a model you pick, and adds a shape verdict without changing the label. Scene, position, AI and action columns hidden for width; table magnified.
Working the list. From the whole scene to one ship’s broadcast identity, then back to the table. Recorded by me in one of my own projects, real data; sped up 1.5 to 3 times between the key moments. The photo inside the card comes from MarineTraffic, credited on screen to its photographer.

A look at the code

The detection rule, rewritten to stand alone. It flags a pixel far brighter than the ring of background around it.

import numpy as np
from scipy.signal import fftconvolve

def ca_cfar(image, k=4.75, guard=4, training=16):
    """Flag pixels much brighter than their own local background.

    guard and training are radii in pixels. A (2*guard+1) box around each
    pixel is excluded from the statistics; the ring outside it, out to
    guard+training, is the background estimate. With the defaults that is
    a 9x9 guard box inside a 41x41 window.
    """
    outer = 2 * (guard + training) + 1
    inner = 2 * guard + 1

    ring = np.ones((outer, outer), dtype=np.float32)
    pad = (outer - inner) // 2
    ring[pad:pad + inner, pad:pad + inner] = 0.0
    n = float(ring.sum())

    mean = fftconvolve(image, ring, mode="same") / n
    mean_sq = fftconvolve(image ** 2, ring, mode="same") / n
    std = np.sqrt(np.clip(mean_sq - mean ** 2, 0.0, None))

    return image > mean + k * std

The cross-check is smaller than people expect. A score that decays with distance and with elapsed time, and 5 labels cut out of it. The first 150 metres are free, because positions wobble (the real tool allows more on radar, which shifts a moving ship).

import math

def match_score(metres_off, seconds_apart):
    """1.0 is perfect. The first 150 m are free; then it falls with metres and seconds."""
    beyond_slack = max(0.0, metres_off - 150)
    return math.exp(-beyond_slack / 500) * math.exp(-abs(seconds_apart) / 1800)

def label(score, ais_nearby, ais_loaded):
    if score > 0.7:
        return "AIS match"
    if score >= 0.3:
        return "Possible AIS match"
    if ais_nearby:
        return "Unmatched (AIS nearby)"
    if not ais_loaded:
        return "No AIS coverage"
    return "Unmatched"

# 400 m and 5 minutes from where the track puts the ship: close, not conclusive.
print(round(match_score(400, 300), 2))                 # 0.51
print(label(match_score(400, 300), True, True))        # Possible AIS match
print(label(0.0, ais_nearby=False, ais_loaded=True))   # Unmatched
print(label(0.0, ais_nearby=False, ais_loaded=False))  # No AIS coverage

Those thresholds are a judgement, not a measurement. Move 0.3 and you move the boundary between a human looks at this and nobody does.
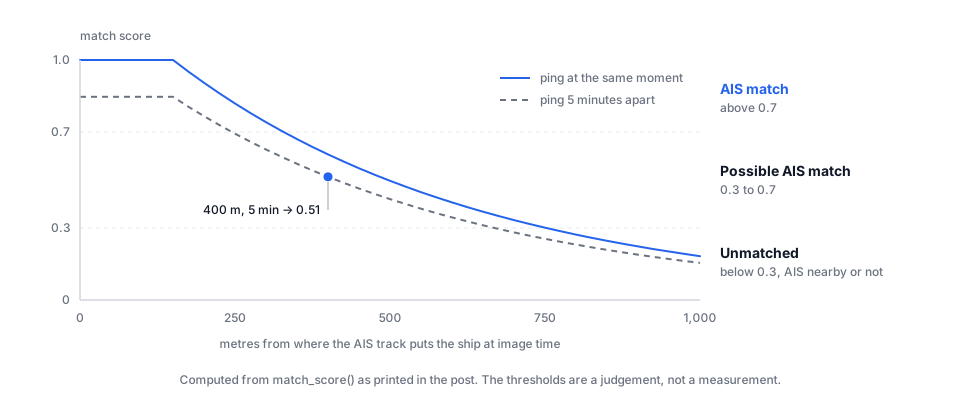
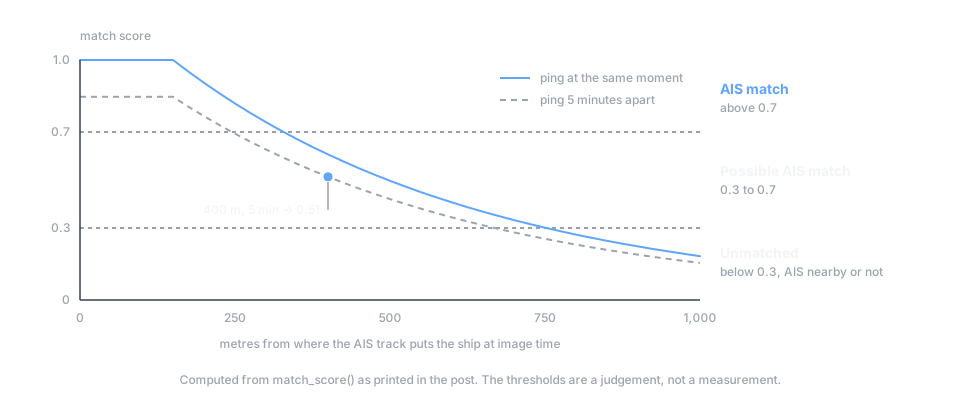
A chart of match score against metres from where the AIS track puts the ship at the moment of the image, 0 to 1,000 metres, computed from the match_score function above. A solid curve for a ping at the same moment stays at 1.0 for the first 150 metres, then falls; a dashed curve for a ping 5 minutes apart sits below it. Dashed lines at 0.7 and 0.3 split the chart into AIS match above 0.7, Possible AIS match from 0.3 to 0.7, and Unmatched below 0.3, with or without AIS nearby. The example point, 400 metres and 5 minutes, is marked at 0.51. A chart of match score against metres from where the AIS track puts the ship at the moment of the image, 0 to 1,000 metres, computed from the match_score function above. A solid curve for a ping at the same moment stays at 1.0 for the first 150 metres, then falls; a dashed curve for a ping 5 minutes apart sits below it. Dashed lines at 0.7 and 0.3 split the chart into AIS match above 0.7, Possible AIS match from 0.3 to 0.7, and Unmatched below 0.3, with or without AIS nearby. The example point, 400 metres and 5 minutes, is marked at 0.51.
Where the labels fall. On the same-moment curve the score holds at 1.0 for 150 m, leaves AIS match at about 330 m and drops below 0.3 at about 750 m; every gap in time pulls the whole curve down. No AIS coverage is not on the chart: with no data there is nothing to score.

What it can’t do

A detection is a lead, not a finding

“Vessel in the imagery, nothing in AIS” has several dull explanations before it has an interesting one. Reception is not uniform — a satellite receiver has gaps, a terrestrial one has range. The scene and the nearest ping can be minutes apart, and minutes at sea are hundreds of metres. Plenty of small craft are not required to carry a transponder at all. And the detector is fallible: a breaking wave, a fixed platform, a sandbank in shallow water.

So the tool never calls anything dark. Dark candidate is a mark only you can set, only on a plain unmatched detection where AIS data was loaded: hull-shaped, not a fixture or a radar ghost (a false echo beside a bright target), and big enough that it should have been transmitting. Even then it means worth an hour of your attention, not that a ship was hiding, and nothing that leaves this tool is publishable on its own.

Fixed where it should be tunable, and narrow in what it accepts
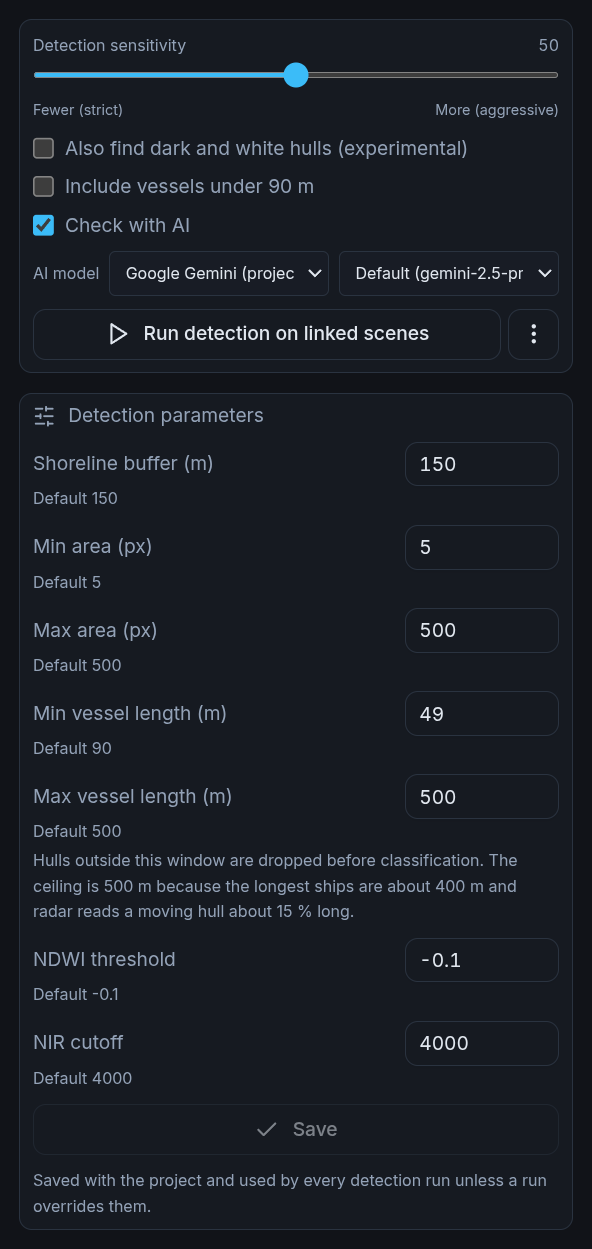
The CFAR constants cannot be changed from the interface, and neither can the image chip, a fixed 64-pixel square around each detection (about 640 metres at 10-metre resolution). Sensitivity is one scalar for the whole scene, so calm water in one corner and a stiff wind in the other are served badly at both ends. Optical search takes atmospherically corrected Sentinel-2 scenes only, ungeoreferenced imagery is rejected, and one commercial provider can be held to 2 downloads an hour.

Detection settings, magnified: a sensitivity slider at 50 between Fewer (strict) and More (aggressive), unticked boxes for Also find dark and white hulls (experimental) and Include vessels under 90 m, a ticked Check with AI box with its model pickers, and a Run detection on linked scenes button. Then Detection parameters: shoreline buffer 150 m, min area 5 px, max area 500 px, min vessel length 49 m against a default of 90, max vessel length 500 m with a note that the ceiling is 500 m because the longest ships are about 400 m and radar reads a moving hull about 15% long, NDWI threshold -0.1 and NIR cutoff 4000, each with its default beneath it, and a greyed-out Save button.

The dials that exist, and the ones that don’t. The sensitivity slider changes what gets detected; the size and shoreline settings below it decide what is kept, and the last 2 belong to the optical water test. From the same Red Sea project, at the defaults except one: the minimum length was lowered to 49 metres, which is why rows under 90 metres reach its table.

Where this sits in the series

This is stage 4 of the 6-stage spine doing its whole job. Collection is a satellite archive, storage is a spatial database, and all the interesting work is in the narrowing.

It is also the cleanest example I have of the argument in where AI actually fits in OSINT. Machine detection here does one thing: it turns a pile you cannot look at into a pile you can. It does not conclude that a ship was running dark. It hands you a chip, a coordinate, a timestamp and an absence, then gets out of the way.

Detection is a scoring step, and a scoring step you have not measured is a scoring step you are guessing about. Does your AI step actually work? is the discipline that turns “it seems to find them” into a number, including what to do when tightening the threshold makes things worse rather than better.

